

Why do prices go up but not down?
Why do the prices we pay always seem to go up but almost never back down?

Why do the prices we pay for things always seem to go up but never back down? The short answer is, that is what prices do, at least for the most part. When prices go up, there are usually associated increases in the costs of producing the things we buy, including higher wages and salaries. Higher prices may also result in higher profits and some of those profits add to ordinary people's investment and retirement accounts. Finding and switching to lower-priced alternatives often takes time and is personally disruptive. Even though we want prices that have gone up to come back down, we don’t want to bear the consequences of doing what would have to be done to bring them back down. That’s why prices generally go up but not back down, at least not all the way back down.
The Consumer Price Index, or CPI, calculated by the Bureau of Labor Statistics, attempts to track prices for all the different things we consumers buy. The CPI doesn’t necessarily reflect the spending patterns of any specific person or family but of consumers in general. Figure 1 shows that consumer prices in the U.S. have increased consistently since the 1950s with prices declining only once during the financial collapse of 2008-2009 and leveling out for short periods in 2014 and 2019.
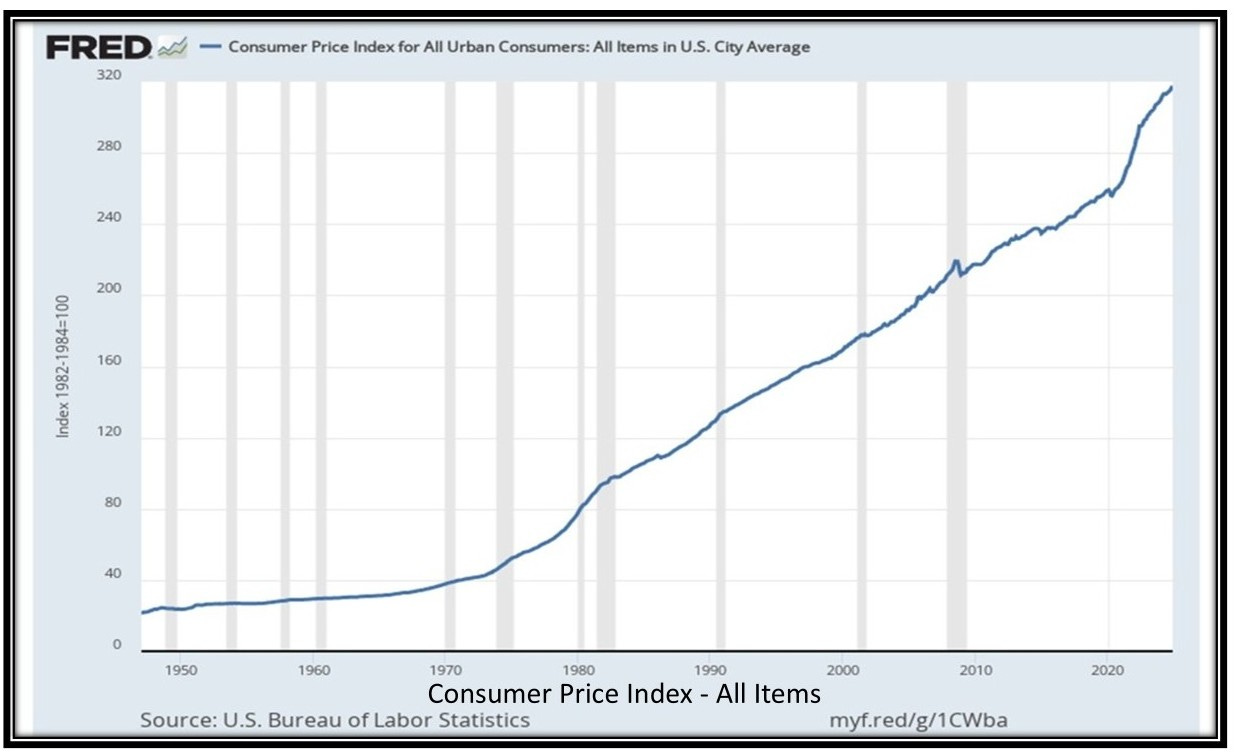
Figure 1 Prices go up but rarely come back down.
Price increases accelerated during the 1970s and early 1980s and have continued to increase faster than during the 1950s and 1960s. The rate of price increases during 2021-2022 was similar but somewhat slower than during the 1970s. Prices for some items, including televisions, computer software, and cell phones, have declined over the past 20 years. However, prices for most items in the CPI have gone up and stayed up.
Price “inflation” refers to price increases over time and is commonly reported as the percentage increase since the same time the previous year. For example, an inflation rate of 5% means that something that cost $1.00 a year ago costs $1.05 today. Figure 2 shows inflation in the U.S. rates for the CPI over the past 20 years. Percentage increases become larger dollar-and-cent increases as prices move higher. For example, consumer prices have risen an average of about 3% per year over the past 25 years, but it takes almost $2.00 today to buy the items in the CPI that cost only $1.00 in 1999.
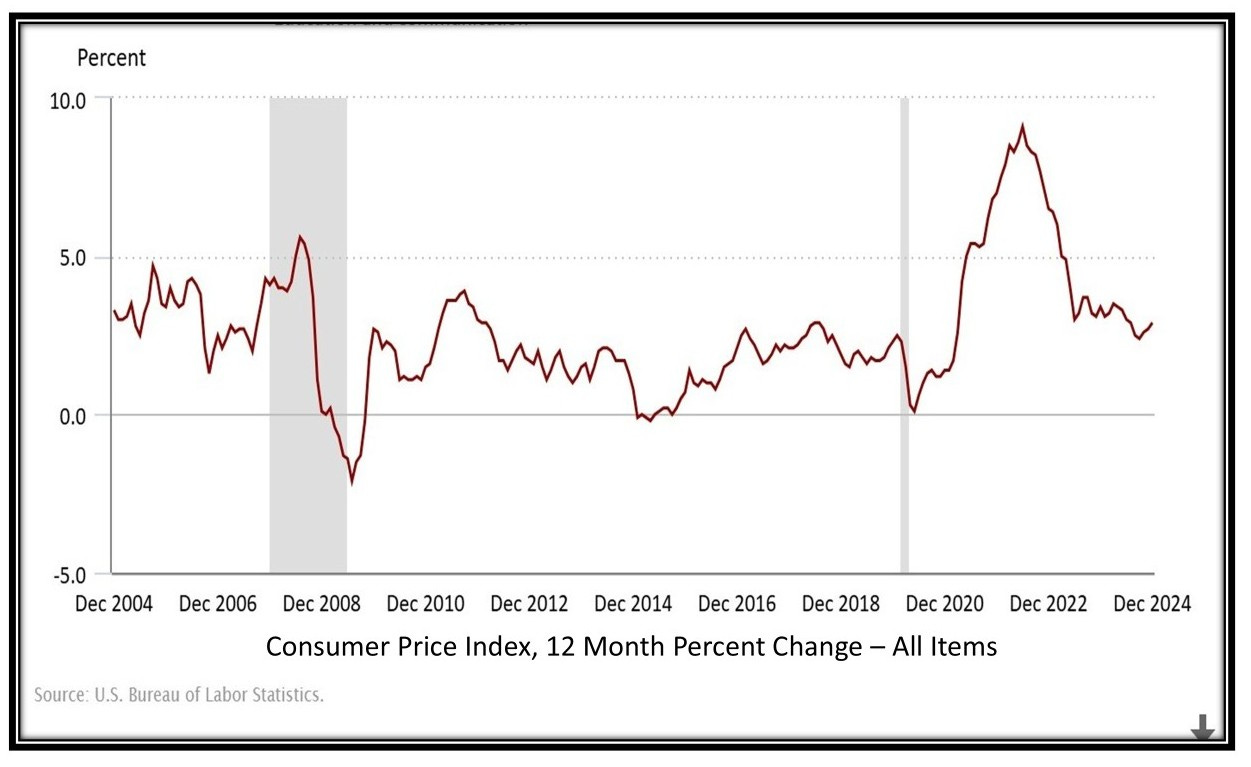
Figure 2. Inflation: the percentage change in consumer prices
Inflation rates for the most part have stayed in the 2% to 5% range over the past 20 years. The only price declines were in 2008-2009, shown in Figure 2 as inflation rates of less than 0.0. Inflation was near 0.0 in the winter of 2013-2014 and again in 2020.
The shaded areas in the chart indicate general economic recessions, meaning that the total value of goods and services produced by the U.S. economy or GDP was declining. The decline in consumer prices during 2008-2009 was associated with the so-called “Great Recession” and unemployment increased from less than 5% in 2007 to more than 10% in late 2009. The COVID-19 recession of 2020 was much shorter, but again, the leveling out of consumer prices was associated with a rise in unemployment to 13% in the fall of 2020. The leveling of prices in 2013-2014 was associated with an economic slowdown in the global economy, including Russia and China, which affected prices in the U.S.
Much of the recent concern about inflation has focused on food prices. Figure 3 shows that food prices are less stable than most other prices in the CPI. The prices in the chart are for foods purchased in supermarkets for home consumption, rather than restaurants. Food prices have typically risen faster than the CPI during periods of increasing inflation and declined faster than the CPI during periods of declining inflation.
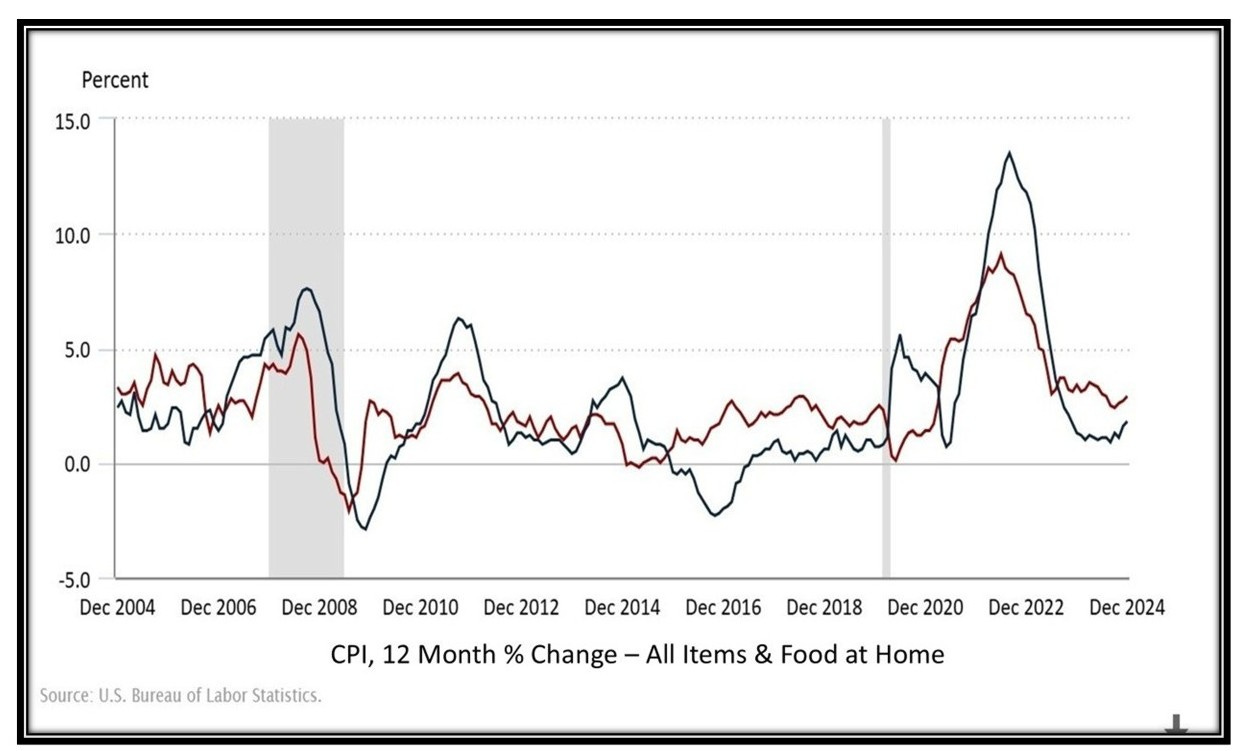
Figure 3 Food prices are less stable than the CPI.
There is also a tendency for food price changes to lag or follow changes in the CPI, but sometimes move in the opposite direction to the CPI. For example, food prices declined during 2015-2016 while other prices rose. Although more volatile than the CPI, food prices increased only slightly more than the CPI over the past 25 years. It took $1.99 in 2024 to buy food items in the CPI that would have cost only $1.00 in 1999, compared to $1.89 for all items included in the CPI.
The volatility in food prices results primarily from the inability to control the production of agricultural commodities. Weather-related crop failures, even in other parts of the world, and disease outbreaks in large animal feeding operations can disrupt supplies and cause retail food prices to rise. For example, the current high prices of eggs reflect sharp reductions in production caused by an outbreak of bird flu in major production areas.
Price volatility is also caused by producers being forced to make decisions without knowing what prices they will get for their products. It takes time to grow or produce market-ready agricultural products. Producers tend to increase the production of specific crops or livestock when prices are high only to discover later that other producers have done the same, which depresses prices when crops are harvested or animal products are ready for sale. Producers then tend to cut back on production, only to discover that others have done the same and they all have fewer commodities to sell when prices are higher.
Figure 3 also shows that the current food supply chain is vulnerable to disruptions unrelated to producers’ decisions. When the COVID-19 pandemic forced food processing plants to shut down, supermarket shelves were quickly emptied. Producers had plenty to sell but no way to get their livestock and crops processed and distributed to supermarkets. Food price inflation rose because of a lack of supply while inflation for other items declined because of a lack of demand. The concentration of food processing and distribution in large corporately controlled operations may increase economic efficiency but are a threat to food price stability and domestic food security.
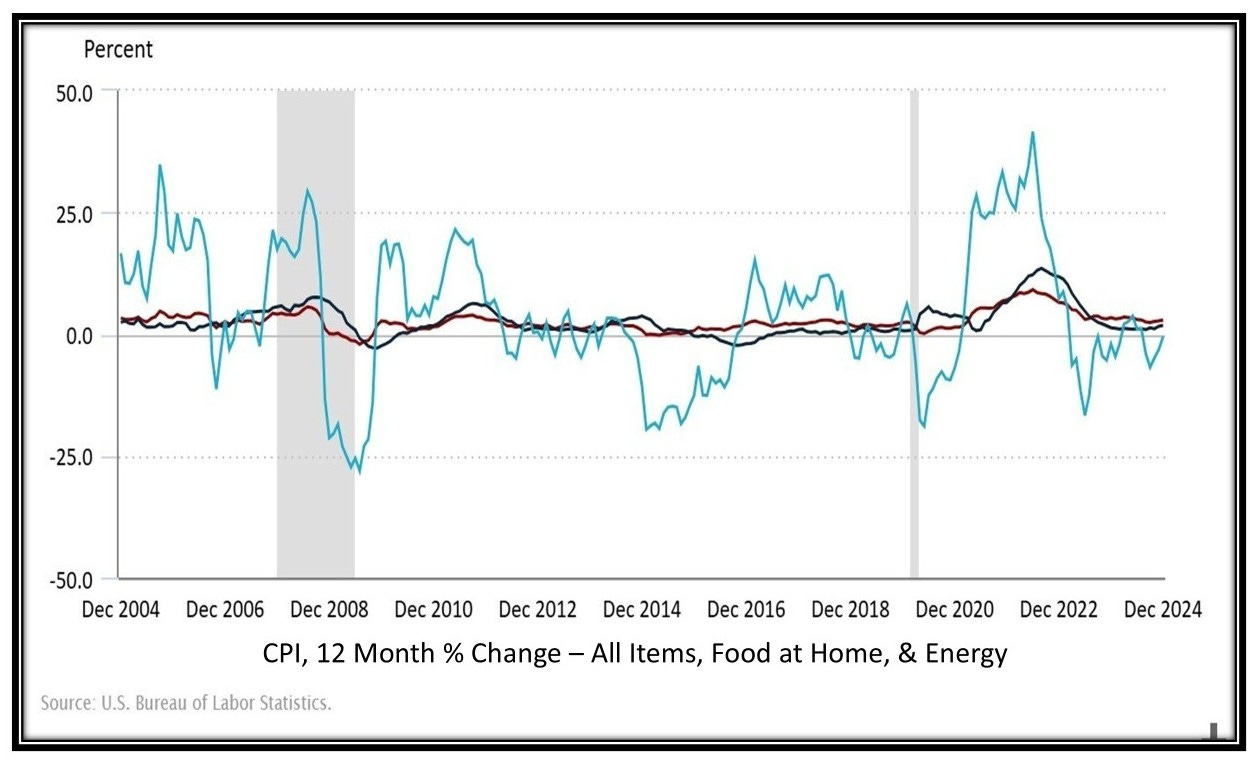
Figure 4. Energy prices are more volatile than food or CPI.
Energy prices are even more volatile than food prices. Figure 4 shows that changes in the prices of food and the CPI overall are both small when compared with the inflation and deflation in energy prices. Energy prices have risen and fallen by more than 25% at times over the past 20 years. Consumers seem to be more tolerant of changes in energy prices than food prices, perhaps because energy prices account for only about 5% of consumer spending compared to about 13% for food. Regardless, lower energy costs contributed significantly to the falling CPI during 2009-2009 and the near 0.0 inflation rates in 2013-2014 and 2021-2022.
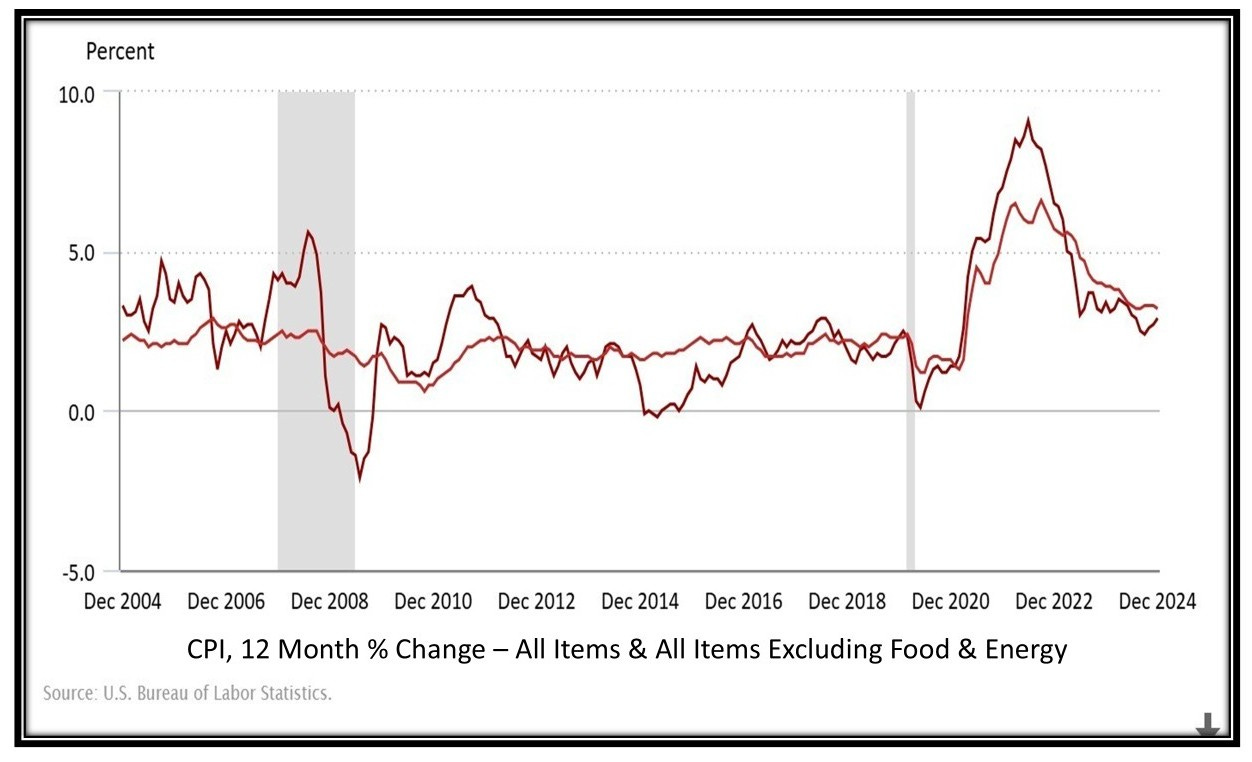
Figure 5 Prices excluding food and energy, have not declined in the past 20 years
Figure 5 shows that when food and energy prices are excluded, prices of other items in the CPI are not only more stable but have not declined during the past 20 years. Changes in food and energy prices sometimes offset opposite changes in other prices, as in 2021-2022 but often magnify changes in the overall CPI, like in 2009-2009. Even though food and energy generally do not dominate consumer spending, they can significantly affect the overall cost of living. However, consumer prices excluding prices of food and energy have not decreased since the Great Depression of the 1930s.
Now to the question of why prices of items other than food and energy go up but almost never come back down. The upward bias in price changes reflects government efforts to maintain full employment by promoting economic growth. The government provides a variety of incentives for businesses to borrow money to invest in new and expanded businesses to create employment. Increased lending and spending by businesses put more money in circulation before additional products are produced to buy with the money. The result is more money to spend relative to the things available to buy, which results in higher prices.
If businesses had to wait until the money was earned and saved before it could be borrowed and spent, the economy would grow more slowly or not at all. There is fear that if economic growth slows or stops, while the workforce continues to grow, unemployment will rise, consumers will buy less, and businesses will slow or stop investing. This could cause further increases in unemployment, reductions in investments, and a downward spiral into a recession or even depression, like in the 1930s. If the amount of money in circulation increases faster than economic growth, there are similar risks of inflationary expectations causing an upward spiral in production costs and consumer prices, similar to the 1970s.
So, the government attempts to maintain inflation at a level that promotes enough economic growth to ensure full employment. The target rate of inflation since the early 2000s has been 2%. If the amount of money in circulation relative to things available to buy exceeds 2%, then prices go up faster than 2%. This was the case in 2021-2022 when supply chain disruptions reduced the supply of things to buy and government stimulus programs increased the amount of money available to consumers to buy them. The COVID-19-induced price inflation was relatively easy to bring back down to the 2% range because it didn’t create expectations that inflation would continue to rise but would come back down when supply chain problems were resolved.
Economists refer to the tendency of consumer prices to stay up once they go up as downward “stickiness.” Food prices are sticky both upward and downward. Food retailers are reluctant to change their prices every time there are fluctuations in their costs of agricultural products. So they absorb some cost increases when supplies are tight and make up for the smaller margins by keeping their prices higher when increases in agricultural production bring their procurement costs down to previous levels. There is a natural tendency, in the absence of effective competition, for retailers to keep prices higher for longer after their costs go down than they wait to increase prices when their costs go up.
Prices tend to be sticky for items where the cost of wages and salaries represents a large percentage of the total cost of production. More than half of the total retail price of food is associated with the salary, wages, and benefits of hired workers in the agri-food supply chain. Once wages and salaries rise, they generally don’t go back down unless there is an economic recession. Businesses typically lay people off workers rather than reduce workers’ compensation because of the resistance among workers and the general public against reducing wages and salaries. High employment costs and downward sticky prices also characterize health care, clerical work, and personal services in general.
Prices tend to be sticky downward for all items in the CPI where the cost of wages and salaries represents a large percentage of the total cost of production. In addition to the food sector, high employment costs characterize health care, clerical work, and personal services in general. Businesses typically lay people off workers rather than reducing wages and salaries to reduce production costs. There seems to be less resistance to increasing unemployment than reducing wages and salaries among workers and the public in general. So, significant price decreases in economic sectors with high employment costs are generally associated with economic recessions and high unemployment.
Price increases for housing, transportation, and restaurants are also downward sticky, primarily because of the difficulty involved in consumers finding and changing to lower-cost alternatives. Housing claims about one-third of consumer spending, transportation accounts for about one-sixth, and about half of food spending is for meals away from home. Price increases for these services have a significant impact on living costs.
However, changes in housing, even for renters, involve moving costs and the hassle of finding a new place to live and settling into a new neighborhood. Switching to public transportation, or even just downsizing to a cheaper car, often requires other lifestyle changes. Consumers could also bring down prices in restaurants by preparing more meals at home. However, more cooking and dishwashing may require lifestyle changes for whole families. Most people just pay the higher prices for many things, even if it means borrowing money, hoping their wages or salaries will eventually catch up.
That’s why prices seem to always seem to go up but rarely come down. Our society has accepted economic growth as a means of ensuring full employment and full-time employment as essential for a desirable quality of life. We don’t want the government to do the things it would need to do to keep prices from rising or bring them back down once they have gone up because it would threaten economic growth and employment. We are also unwilling to make changes in lifestyles necessary to take advantage of existing opportunities to reduce our cost of living and pressure prices to adjust downward. And, we, collectively, have expressed a preference for the promise of lower prices by large corporate businesses rather than government enforcement of antitrust laws to make markets economically competitive to keep prices responsive to changes in supply and demand.
Continuing economic growth is not sustainable on a planet with a finite supply of economic resources and limited space to dump the inevitable wastes generated by economic activity. But, we collectively aren’t willing to vote for politicians or support government programs unless they promise to keep the economy growing, maintain full employment, and control inflation in prices. We can blame the government or we can blame corporate monopolies, but ultimately, we as a society are the reason why prices continue to go up but rarely come back down.
John Ikerd
Notes:
https://www.in2013dollars.com/us/inflation/1999?amount=100
https://www.visualcapitalist.com/inflation-chart-tracks-price-changes-us-goods-services/
https://fred.stlouisfed.org/series/CPIAUCSL
https://www.bls.gov/charts/consumer-price-index/consumer-price-index-by-category-line-chart.htm
https://www.federalreservehistory.org/essays/great-recession-of-200709
https://www.investopedia.com/terms/p/price_stickiness.asp
https://www.ers.usda.gov/data-products/food-dollar-series/documentation#:~:text
Excellent, thanks John